Data-Driven Design: Enhance User Experience with Data Insights

12minutes read
data-driven-design

Can you believe companies using data-driven design outperform competitors by 85% in sales growth? In today's market, user experience can make or break a product, and leveraging data is crucial.

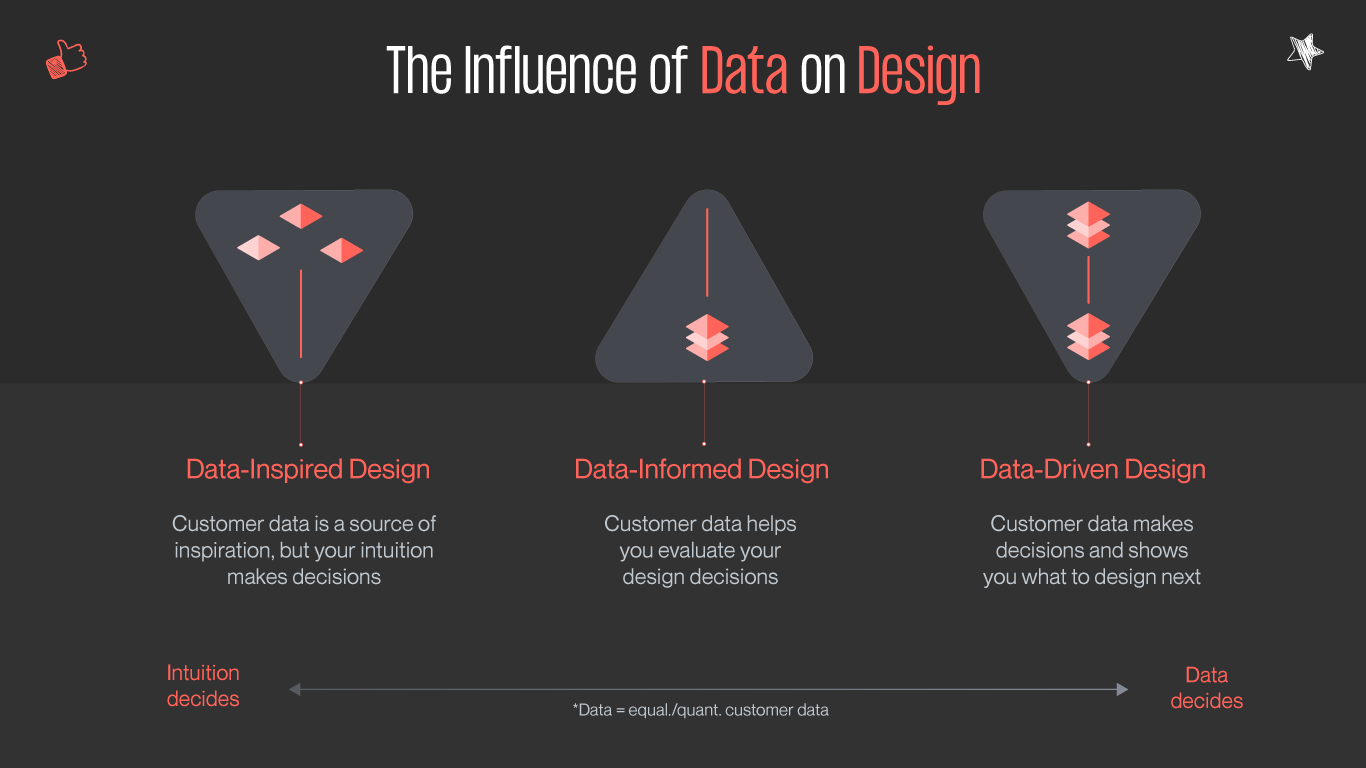
This article will explore how holistic design and data-driven approaches combine to create user-friendly products. The holistic design considers every aspect of the user experience, significantly influencing perceived value and satisfaction.

We were shocked that over 70% of users leave a site due to poor user experience. Data-driven methods can drastically reduce this bounce rate. Imagine retaining and converting those users by making informed design choices!
You'll find actionable insights on transforming your user experience with data-driven design supported by recent studies and reports. We'll offer tips on leveraging analytics, showcase case studies, and provide practical advice for implementing these strategies. Ready to dive in? Let’s explore how data can drive your design to new heights!

What Is Data Driven Design?

Data-driven design is an approach to product development that leverages data analytics to guide design decisions, ensuring that the end product meets user needs and preferences more accurately. This methodology involves the systematic collection, analysis, and application of user data throughout the design process. By understanding how users interact with a product, designers can make informed decisions that enhance usability, functionality, and overall user experience.

The influence of data on design

At the core of data-driven UX design is the concept of continuous feedback loops. These loops involve regularly gathering data on user behavior, preferences, and feedback through various means such as surveys, usability tests, and analytics tools. This data is then analyzed to identify patterns, trends, and areas for improvement. For instance, designers can track which features users engage with the most, where they encounter difficulties, and how their interactions evolve over time.

The data-driven design process typically includes the following steps:

Data Collection:

User data is gathered from multiple sources, including website analytics, mobile app usage statistics, user feedback forms, and social media interactions. Advanced tools and technologies such as heatmaps, session recordings, and A/B testing are often employed to gain deeper insights into user behavior.

Data Analysis:

Once collected, the data is analyzed to uncover insights and trends. This analysis helps identify user pain points, preferences, and behaviors that might not be immediately obvious. Techniques such as statistical analysis, machine learning, and data visualization are used to interpret the data effectively.

Hypothesis Formation:

Based on the insights gained from data analysis, designers formulate hypotheses about how certain design changes could improve the user experience. These hypotheses are specific, testable predictions that guide the next steps in the design process.

Design Iteration:

With hypotheses in hand, designers create prototypes or make adjustments to the existing design. These changes are then tested with real users to gather feedback and observe their impact. This iterative process ensures that the design evolves in response to actual user needs and behaviors.

Validation and Refinement:

The prototypes or design changes are tested, often through controlled experiments like A/B testing, to validate the hypotheses. The results of these tests provide further data, which is analyzed to determine the effectiveness of the design changes. Successful changes are implemented, while unsuccessful ones are re-evaluated and refined.

Implementation and Monitoring:

Once validated, the design changes are fully implemented into the product. Continuous monitoring of user interactions and feedback ensures that the design remains effective and can be further refined as needed.

By following this cyclical process, data-driven UX design helps create products that are not only functional and aesthetically pleasing but also highly intuitive and satisfying for users. This approach reduces the reliance on guesswork and subjective judgment, leading to more reliable and successful outcomes.

In essence, data-driven design is about creating a dynamic relationship between designers and users, where user data continually informs and shapes the design. This leads to products that are better aligned with user expectations, resulting in higher satisfaction, increased engagement, and, ultimately, greater success in the market.

Benefits of Data-Driven Design

Adopting a data-driven approach to design offers numerous advantages that can significantly improve the success of a product. Here are some of the key benefits:

Enhanced User Experience

By analyzing user data, designers can identify pain points and preferences, leading to more intuitive and satisfying user experiences. This can result in higher user retention and satisfaction.

Informed Decision-Making

Data-driven design provides concrete evidence to support design decisions, reducing guesswork and allowing teams to make more confident and accurate choices.

Improved Product Performance

Products designed with data-driven insights are often more efficient and effective as they are tailored to real user needs and behaviors. This can lead to increased usability and functionality.

Higher Conversion Rates

Understanding user behavior through data can help optimize design elements that drive conversions, such as call-to-action buttons, layout, and navigation paths.

Cost Efficiency

By identifying and addressing design issues early through data analysis, companies can avoid costly redesigns and minimize development time and expenses.

Competitive Advantage

Companies that effectively use data-driven design can stay ahead of competitors by continuously improving their products based on real user feedback and trends.

In conclusion, data-driven design is a powerful approach that transforms how products are developed, ensuring they are more aligned with user needs and market demands. By embracing this methodology, companies can create superior products that offer exceptional user experiences and achieve greater success in the marketplace.

Read also: The Power of Data-Driven Web Design

Understanding Data in Design

In the realm of design, data serves as a guiding light, illuminating the path toward creating products that resonate deeply with users. By comprehensively understanding the role of data, designers can harness its power to inform and enhance every stage of the design process.

From concept to execution, data plays a pivotal role in shaping design decisions. At its core, data empowers designers to move beyond intuition and subjective opinions, guiding them toward evidence-based solutions that are grounded in user behavior and preferences.

In the realm of design, data serves as a guiding light, illuminating the path toward creating products that resonate deeply with users. By comprehensively understanding the role of data, designers can harness its power to inform and enhance every stage of the design process.

Quantitative Data

Quantitative data provides designers with valuable numerical insights into user interactions and engagement metrics. Whether it's analyzing website traffic patterns or tracking user interactions within an application, quantitative data offers concrete metrics that highlight user preferences and pain points.

Quantitative Data
Quantitative Data
  • Numerical Insights: Quantitative data provides designers with valuable numerical insights into user interactions and engagement metrics.
  • Website Traffic Analysis: It involves analyzing website traffic patterns to understand user behavior and preferences.
  • Application Usage Tracking: Quantitative data allows tracking user interactions within an application, highlighting usage patterns and areas of interest.
  • Concrete Metrics: Quantitative data offers concrete metrics such as click-through rates, conversion rates, and time spent on specific tasks, which highlight user preferences and pain points.

Qualitative Data

In contrast to quantitative data, qualitative data delves into the subjective realm of user experiences, opinions, and attitudes. Through methods such as surveys, interviews, and usability testing, qualitative data unveils the underlying motivations and emotions driving user behavior. This rich qualitative context complements quantitative metrics, providing designers with a deeper understanding of user needs and desires.

Qualitative
Qualitative data
  • Subjective Experiences: Qualitative data delves into the subjective realm of user experiences, opinions, and attitudes.
  • Methods: It is gathered through methods such as surveys, interviews, and usability testing.
  • Uncovering Motivations: Qualitative data unveils the underlying motivations and emotions driving user behavior, providing designers with a deeper understanding of user needs and desires.
  • Rich Context: This rich qualitative context complements quantitative metrics, offering valuable insights into user motivations and preferences.

Behavioral Data

Behavioral data offers real-time insights into how users interact with a product. By tracking user actions such as clicks, scrolls, and navigation paths, designers can gain valuable insights into user behavior patterns. Behavioral data serves as a window into the user's journey, revealing areas of friction and opportunities for improvement.

Behavioral Data
Behavioral Data
  • Real-Time Insights: Behavioral data offers real-time insights into how users interact with a product.
  • User Actions Tracking: It involves tracking user actions such as clicks, scrolls, and navigation paths.
  • User Journey Analysis: Behavioral data serves as a window into the user's journey, revealing areas of friction and opportunity for improvement.
  • Identifying Patterns: By analyzing behavioral data, designers can identify recurring patterns and trends in user behavior, guiding design decisions.

Empowering Design Decisions

By embracing data-driven design principles, designers can make informed decisions that prioritize user needs and preferences. Whether it's optimizing user interfaces, refining user flows, or iterating on design concepts, data serves as a guiding compass, directing designers toward solutions that resonate with users on a profound level.

In essence, understanding data in design is about embracing a holistic approach that integrates quantitative insights, qualitative understanding, and behavioral observations. By leveraging the power of data, designers can create transformative experiences that captivate and delight users, ultimately shaping the future of design innovation.

Incorporating Data into the Design Process

Data serves as a cornerstone in the design process, providing invaluable insights to guide decisions and enhance user experiences. Here's how data can be seamlessly integrated into the design workflow:

Research Phase

Defining Objectives and Key Metrics

  • Begin by clearly defining the objectives of the design project. What are the overarching goals you aim to achieve?
  • Identify key metrics that will measure the success of the design initiative. These metrics should be aligned with the project objectives and provide tangible benchmarks for evaluation.

Collecting and Analyzing Data

  • Utilize a variety of data collection methods to gather relevant information. This may include surveys, interviews, user feedback, market research, and analytics tools.
  • Once data is collected, conduct a thorough analysis to extract meaningful insights. Look for trends, patterns, and user behaviors that can inform design decisions.
  • For instance, analyzing user engagement metrics and heatmaps can reveal areas of high interaction and areas where users may encounter obstacles.

Design and Prototyping Phase

Iterative Design Process

  • Incorporate data insights into the iterative design process. Use quantitative and qualitative data to refine design concepts and iterate on prototypes.
  • Test different design variations and gather feedback from users to validate design decisions. A/B testing and usability testing can help identify which design elements resonate best with users.

Data-Driven Design Decisions

  • Base design decisions on data-backed evidence rather than assumptions or personal preferences. Let user behavior and feedback guide design iterations.
  • Prioritize design changes that address identified pain points and align with user needs and preferences.

Implementation and Evaluation Phase

Monitoring and Optimization

  • Continuously monitor user interactions and gather feedback post-implementation. Use analytics tools to track user behavior and measure key performance indicators.
  • Identify areas for improvement based on real-time data insights. Implement iterative changes to refine the design further and enhance the user experience.
  • Feedback Loop Closure
  • Close the feedback loop by integrating user feedback and data insights into future design iterations. Maintain a cycle of continuous improvement to ensure the design remains responsive to user needs and market trends.

By seamlessly integrating data into each phase of the design process, designers can create products and experiences that are not only visually appealing but also highly functional and user-centric. Data-driven design empowers designers to make informed decisions that resonate with users and drive meaningful outcomes.

Tools & Technologies for Data-Driven Design

Data-driven design relies on a variety of tools and technologies to collect, analyze, and leverage data effectively throughout the design process. Here are some essential tools and technologies:

Tools and technologies for data-driven design

Analytics Platforms

  • Google Analytics: A powerful web analytics platform that provides insights into website traffic, user behavior, and conversion metrics.

  • Mixpanel: Enables tracking of user interactions with web and mobile applications, offering advanced analytics and user segmentation features.

  • Adobe Analytics: Provides comprehensive analytics capabilities for tracking and analyzing user behavior across digital channels.

User Feedback Tools

  • UserTesting: Allows designers to conduct remote usability testing with real users, gathering feedback on design prototypes and live websites.

  • SurveyMonkey: Facilitates the creation and distribution of surveys to collect qualitative feedback from users on their preferences and experiences.

  • Hotjar: Offers heatmaps, session recordings, and user feedback polls to understand how users interact with web pages and identify areas for improvement.

Prototyping Tools

  • Sketch: A popular design tool for creating high-fidelity prototypes and mockups with a focus on user interface and experience design.

  • Adobe XD: Enables designers to design, prototype, and collaborate on user experiences for web and mobile applications.

  • Figma: A collaborative interface design tool that allows real-time collaboration and prototyping in the browser.

A/B Testing Platforms

  • Optimizely: Allows designers to create and run A/B tests to compare different variations of a design and measure their impact on user behavior and key metrics.

  • VWO (Visual Website Optimizer): Offers A/B testing, multivariate testing, and split URL testing to optimize web pages for better user engagement and conversion rates.

You may also like: How to Conduct an A/B Testing in Design?

Data Visualization Tools

  • Tableau: Enables designers to create interactive data visualizations and dashboards to explore and communicate insights from large datasets.

  • Power BI: Provides tools for data analysis, visualization, and sharing, allowing designers to create compelling data stories and reports.

Machine Learning and AI

  • TensorFlow: An open-source machine learning framework that allows designers to build and deploy machine learning models to analyze user data and predict user behavior.

  • IBM Watson: Offers AI-powered tools and services for natural language processing, image recognition, and sentiment analysis, enabling designers to derive insights from unstructured data sources.

By leveraging these tools and technologies, designers can harness the power of data to create user-centric designs that drive engagement, satisfaction, and business success.

Successful Applications of Data-Driven Design

Data-driven design has been instrumental in the success of numerous products and services across various industries. Here are some examples of successful applications:

Netflix

  • Netflix leverages data-driven design to personalize the user experience and recommend content based on viewers' preferences and behavior.
  • By analyzing user interactions, viewing history, and ratings, Netflix delivers highly targeted recommendations, leading to increased user engagement and retention.

Amazon:

  • Amazon utilizes data-driven design to optimize its website and personalize product recommendations for shoppers.
  • Through techniques such as collaborative filtering and predictive analytics, Amazon tailors the shopping experience based on users' browsing history, purchase patterns, and demographics.

Spotify:

  • Spotify employs data-driven design to curate personalized playlists and recommendations for its users.
  • By analyzing listening habits, favorite genres, and user-generated playlists, Spotify delivers customized music recommendations that resonate with individual tastes and preferences.

Google Maps:

  • Google Maps integrates data-driven design to enhance the accuracy and usability of its mapping service.
  • Through real-time traffic data, user location history, and user feedback, Google Maps provides dynamic routing and navigation options that optimize travel time and avoid congestion.

Airbnb:

  • Airbnb uses data-driven design to optimize its platform and match travelers with accommodations that meet their preferences.
  • By analyzing user search behavior, booking history, and reviews, Airbnb suggests relevant listings and provides personalized recommendations, enhancing the booking experience for users.

Waze:

  • Waze applies data-driven design to crowdsource traffic information and improve its navigation app.
  • Through real-time user reports, traffic data, and historical patterns, Waze provides accurate and up-to-date navigation instructions, helping users avoid accidents, road closures, and traffic jams.

Fitbit:

  • Fitbit employs data-driven design to track users' fitness activities and provide personalized insights and recommendations.
  • Byq collecting data on users' daily steps, heart rate, sleep patterns, and exercise routines, Fitbit offers tailored guidance to help users achieve their health and fitness goals.

These examples demonstrate the diverse applications of data-driven design across industries, highlighting its ability to optimize user experiences, drive engagement, and deliver value to both users and businesses.

Transform Your Vision with Gapsy Studio

In conclusion, the transformative power of data-driven design cannot be overstated. From personalized recommendations on streaming platforms to optimized navigation experiences in mapping apps, data-driven design has reshaped the way we interact with digital products and services. By leveraging user data to inform design decisions, companies can create experiences that are not only intuitive and engaging but also highly tailored to individual preferences.

At Gapsy Studio, we understand the importance of creating exceptional user experiences. Our UI/UX design services are driven by a deep understanding of user behavior and preferences, ensuring that every design decision is backed by data insights. Whether you're looking to revamp your existing product or develop a new digital experience, our team of experts is here to help.


Ready to elevate your digital presence? Visit our website to learn more about our UI/UX design services and see how we can help bring your vision to life. Don't hesitate to reach out to us through our contact page to discuss your project requirements in detail. Let's collaborate to create designs that captivate, inspire, and delight users. Your journey to exceptional design begins with Gapsy Studio.

Rate this article

20 ratings
Average: 4.9 out of 5

If you like what we write, we recommend subscribing to our mailing list to always be aware of new publications.

Do you have any questions? We tried to answer most of them!