Enhancing Website Usability with Heat Map UX Techniques

12minutes read
ux-heat-map

Do you ever ponder the rationale behind the specific arrangement of information on websites and mobile apps? Ever notice how some call-to-action (CTA) buttons are irresistibly clickable, or why popups are frequently employed to boost user engagement? The creation of interactive and user-friendly websites and mobile apps involves numerous tactics by UI/UX designers. Beneath the surface of these sophisticated designs lies a systematic approach, largely influenced by the utilization of heatmaps.

UX heatmaps provide a lens through which user interaction on webpages is visualized and understood. These tools offer insights not just into where users click but also their scrolling behavior and the duration of their visit. Employing heatmaps is an invaluable technique in evaluating a site's performance and ensuring that its content aligns with intended objectives.

This article will introduce you to seven leading heatmap UX tools that promise to enhance your projects significantly. Continue reading to discover how these tools can revolutionize your approach to website design and ultimately benefit your business.

What is a Heatmap?

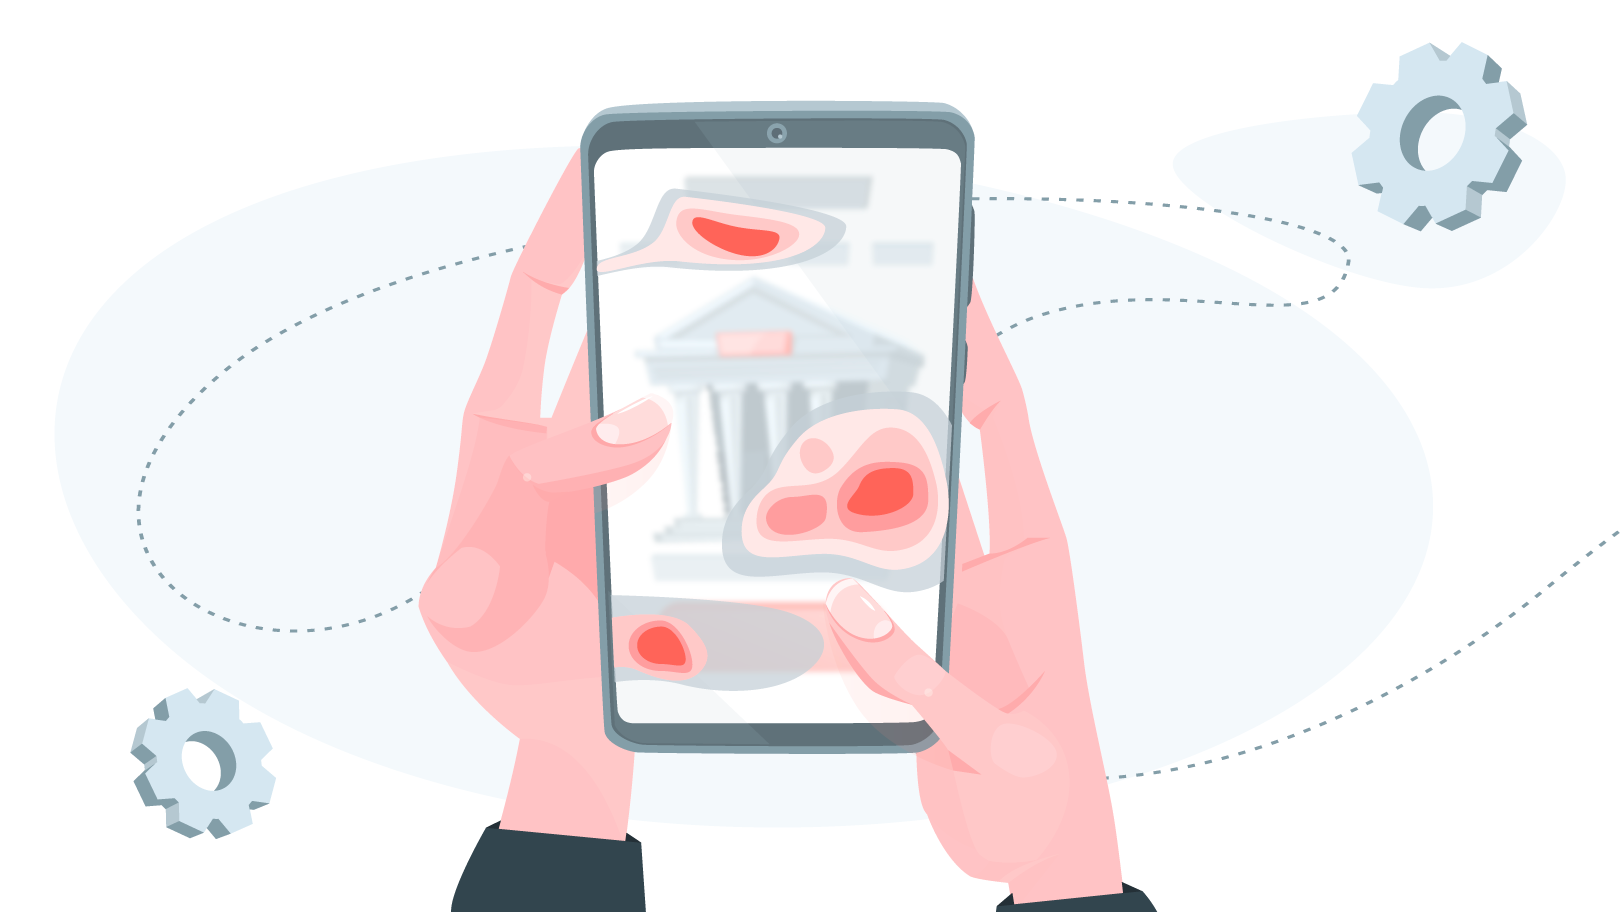
So, what exactly is a heatmap? A heatmap, such as those created using heatmap.js, is a graphical representation that highlights the hotspots of user activity on a website. It reveals which elements are successfully engaging users and which ones might need tweaking. For instance, if a “Subscribe to Newsletter” button is being overlooked, a redesign might be in order, incorporating more eye-catching colors or prominent placement. UX web design agencies leverage the insights from UX heatmaps to refine and optimize websites continually.

While the concept and application of heatmaps might seem daunting at first, a plethora of resources and tools are available to assist UI/UX designers in this endeavor. High-quality UX heatmap UX tools enable professionals to dissect user behavior, glean meaningful insights, and craft forward-looking strategies.

What is a heatmap?
Heatmap definition

Heatmaps are invaluable assets for UI/UX designers, providing clear, actionable data on user interaction within digital spaces. They illuminate how users engage with content, offering direct feedback critical to the success of digital interfaces. By employing heatmaps, professionals obtain high-quality insights that are instrumental in refining user experience across desktop and mobile platforms.

Read also: Empathy Mapping UX: Understanding and Entering the User's Mindset

Utilizing heatmaps in UX design offers genuine, unmoderated user interactions, capturing real-world behaviors. This unfiltered data enhances the reliability of the insights, aiding in the formulation of potent strategies to enhance overall engagement and usability.

Heatmap red zones on the screen
Heatmap zones

Exploring the Critical Role of Heatmaps in UI/UX Design

The pivotal role of heatmaps in enhancing UX is widely acknowledged. Businesses leverage these tools to refine their marketing efforts and advertising tactics, which often leads to a noticeable uptick in conversion rates. Heatmaps also incorporate users into the design journey, embracing design thinking principles. This inclusion is instrumental for designers to pinpoint user challenges and tailor solutions effectively. Heatmaps are especially vital in certain UI design aspects, including:

CTA Buttons

Evaluating the effectiveness of CTA buttons is crucial in understanding content performance. Heatmaps offer a straightforward visual of which CTAs are garnering attention and which might require revision. By analyzing heatmaps, you can immediately discern the level of engagement each CTA button receives.

Navigation Efficiency

Both the main navigation and footer are crucial in shaping user experience. Content organization and language choice in menus significantly impact usability. Heatmaps provide insights into the effectiveness of these elements, highlighting which menu items capture attention and may benefit from further emphasis.

Page Length and Engagement

The extent of a webpage can significantly influence user engagement. Lengthy pages may lead to user fatigue and increased bounce rates. Heatmaps can illustrate user scrolling behavior, revealing the point at which users typically disengage. This data is invaluable in optimizing content layout to maintain interest and reduce information overload.

Detecting Unexpected Click Areas

Users frequently have expectations about the interactivity of certain elements within a website or application design. Commonly, visual cues like a distinctively colored phrase or an underlined text are interpreted as interactive elements, such as hyperlinks. When these expectations are not met, and the elements turn out to be non-interactive, it can lead to misdirected clicks and user frustration. This scenario is particularly true in a digital environment rich with interactive features, where users are accustomed to engaging with various content types intuitively.

Integration with Other UX Tools

Heatmaps, when integrated with other UX tools as part of comprehensive UX mapping methods, significantly enhance user insights. Pairing heatmaps with Google Analytics refines understanding of user interactions and site performance while combining them with SEO tools like SEMrush improves content strategy and visitor engagement. Such integrations can lead to up to 30% improvement in user engagement, emphasizing the effectiveness of a multi-faceted UX design approach.

Varieties of Heatmaps: Exploring Scroll and Confetti Types

Heatmaps are categorized into various types, such as scroll and confetti, each offering unique insights in a user-friendly format.

Scroll heatmaps display a color-coded representation indicating the depth of user's scroll on a page. In contrast, confetti heatmaps, capture click distributions, showcasing mouse clicks as colorful dots across the page.

The choice between scroll and confetti heatmaps—or the combination thereof—depends on the specific user experience insights sought. For instance, scroll heatmaps can reveal if users reach important content at the bottom of a lengthy page, while confetti heatmaps are ideal for analyzing the effectiveness of various interactive elements, such as buttons, in terms of placement, color, and wording.

Device

Purpose

Advantage 

Disadvantage

Mouse Tracking

Tracks and records user mouse movements.

  • Generally more cost-effective.

  • Can be applied to a broad or specific sample group.

  • Provides insights into user clicks, indicating interest points.

  • May lead to ambiguous interpretations.

  • Highlights what users click but not what captures attention without clicks.

Eye Tracking

Tracks and records where users look on a screen.

  • Offers precise insights into initial visual attention.

  • Highly accurate for the specific sample tested.

  • Requires expensive equipment and is costly to implement.

  • Can't easily distinguish between different types of site visitors, potentially affecting data accuracy.

By understanding the types and functionalities of various heatmaps and user behavior tracking tools, designers and marketers can effectively tailor their strategies to enhance user experience and website performance.

You may also like to read: Affinity Map UX: Crafting Seamless User Experience

Benefits and Limitations of Using Heat Maps in User Research

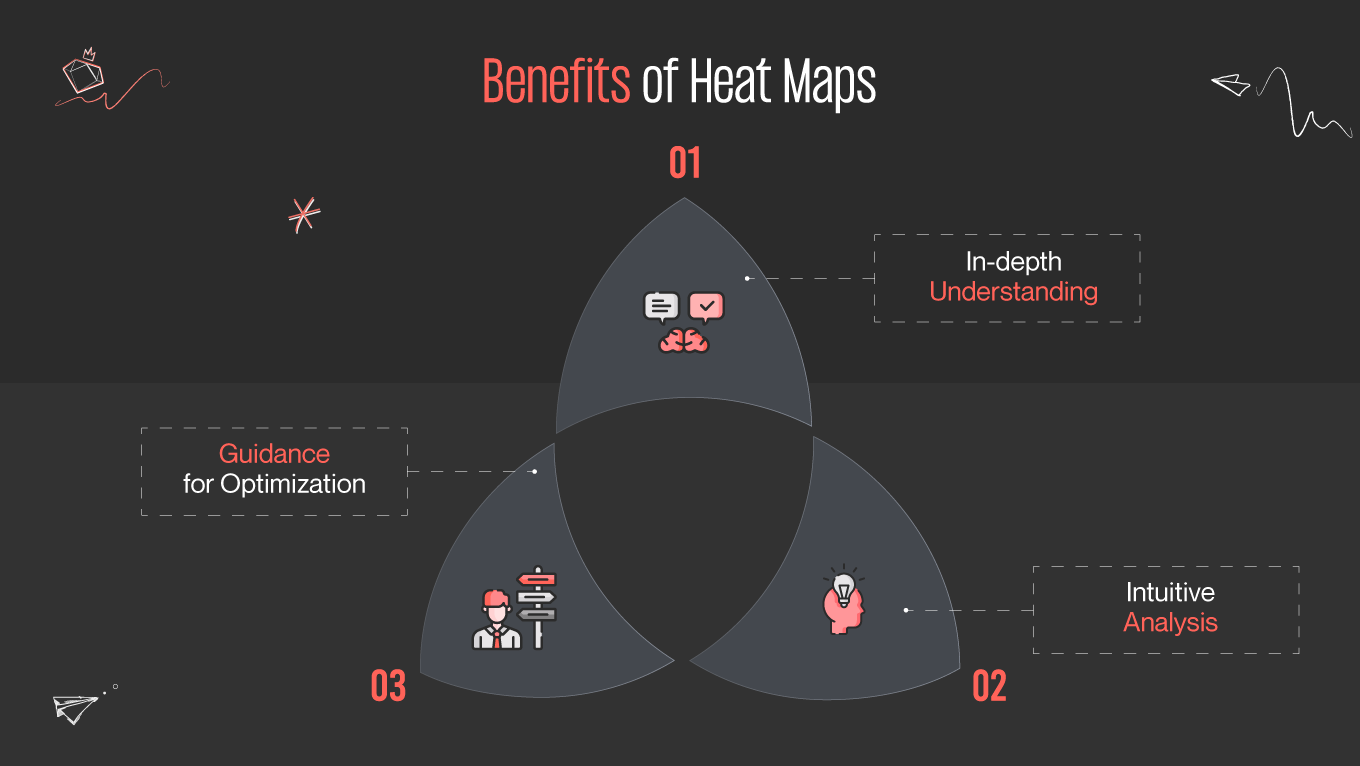
Benefits of Heat Maps:

  • In-depth Understanding: Heat maps provide a deep dive into user behavior, revealing not just actions but potential motivations behind those actions, offering valuable insights into usability aspects.

  • Guidance for Optimization: By analyzing user interactions with prototypes or models, heat maps can signal which design modifications could enhance the user experience.

  • Intuitive Analysis: The visual nature of heat maps makes them straightforward and accessible, allowing a wide range of individuals to understand and derive value from the data presented.

Benefits of heatmap
Heatmap benefits

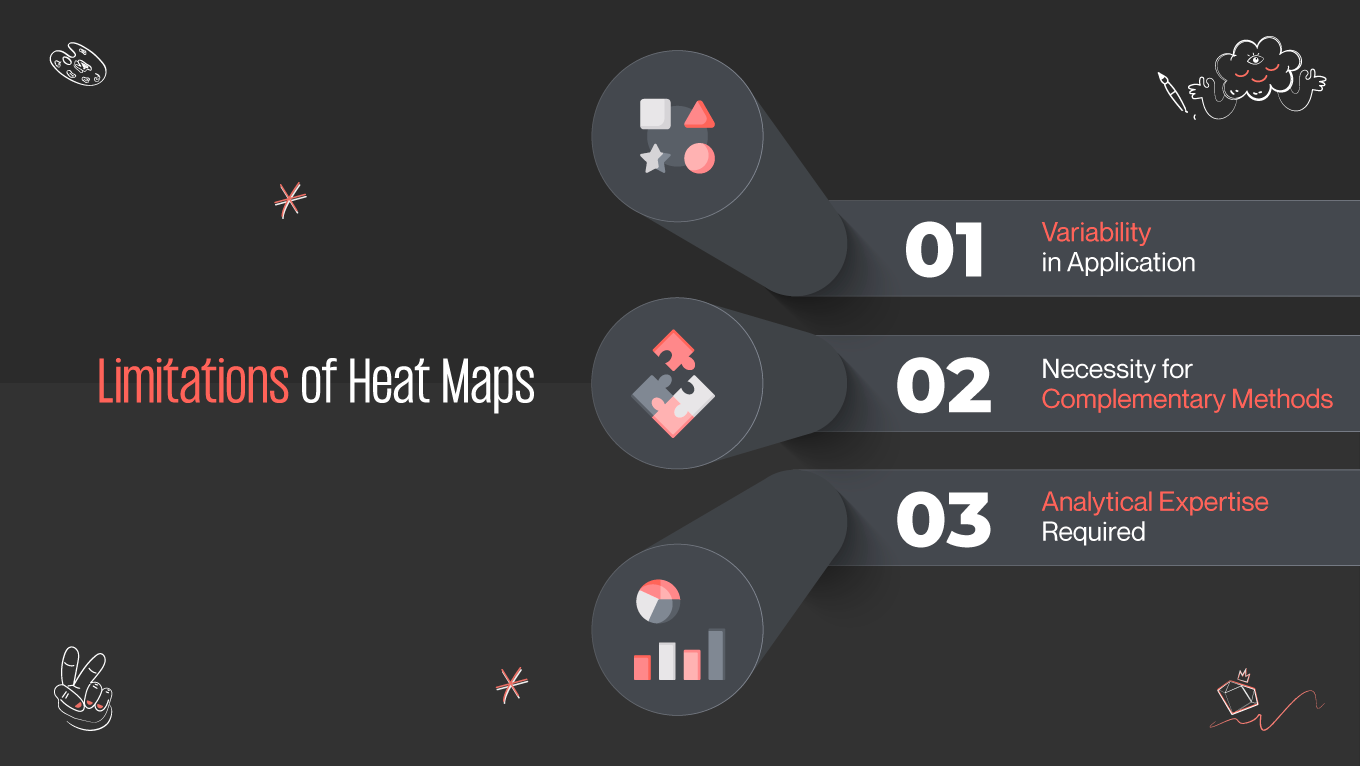
Limitations of Heat Maps:

  • Variability in Application: The effectiveness of heat map analysis can fluctuate significantly based on the type of tracking technology used (eye vs. mouse tracking) and the heat map style (scroll vs. confetti). This variability can affect the accuracy and relevance of conclusions drawn.

  • Necessity for Complementary Methods: Heat maps often require the support of additional analytical and testing methods to provide a comprehensive understanding of user behavior and design impact.

  • Analytical Expertise Required: Without a foundational understanding of data analysis, researchers might find it challenging to extract the full depth of insights that heat maps can offer, potentially leading to superficial or misinterpreted conclusions.

Limitations of heatmap
Heatmap limitations

Best Heatmaps Tools To Use

Hotjar stands out as a comprehensive analytics and feedback platform, combining heatmaps, session recordings, and surveys to provide a full spectrum view of user behavior on websites and applications. It captures a visual representation of clicks, scrolls, and mouse movements, as well as direct user feedback to help teams understand what users want, care about, and interact with on their site. By offering both quantitative and qualitative data, Hotjar allows for a deep dive into the user experience, facilitating a more empathetic approach to web design and improvement. This tool is particularly beneficial for teams looking to streamline and enhance the user journey, ensuring that every website or app modification is grounded in solid user feedback and behavior analytics.

Hotjar
Hotjar heatmap UX tool
  • Features: Click, move, and scroll heatmaps, session recordings, funnel analysis, form analytics, and feedback polls.
  • Advantages: Intuitive interface, versatile data collection methods, and visual representation of user interaction.
  • Disadvantages: Data sampling in the free version and can become costly for larger volume sites.
  • Cost: Free limited plan available; Plus plan starts at $39/month with more features and data capacity.

Crazy Egg is a robust analytics tool that provides businesses with deep insights into how users interact with their websites. By offering detailed heatmap UX design, scroll maps, and click reports, it helps in visualizing user activity and identifying patterns that might not be evident through traditional analytics. With its ability to record user sessions and conduct A/B testing, Crazy Egg allows businesses to experiment with and optimize different elements of their websites, ensuring that they meet their users' needs and preferences effectively. This tool is particularly popular for its user-friendly interface and precise data that empower website owners to make data-driven design and content decisions.

Crazyeggr
Crazyegg heatmap tool
  • Features: Click heatmaps, scroll maps, referral maps, and A/B testing.
  • Advantages: User-friendly, quick setup, and specific insights into where users click and how far they scroll.
  • Disadvantages: Limited features on cheaper plans and snapshot limits.
  • Cost: Plans start at $24/month after a 30-day free trial.

Mouseflow is a comprehensive analytics tool that provides advanced session replay and heatmap UX capabilities to delve deep into user behavior. It captures every click, scroll, and movement, translating them into visual heatmaps and insightful replays. This robust tool is designed to uncover patterns, pinpoint pain points, and highlight opportunities for optimization, offering a granular view of how users interact with every element of a website. It's particularly valuable for understanding complex user journeys and improving site usability and conversion rates.

Heatmap with Mouseflow
Mouseflow heatmaps
  • Features: Session replay, heatmaps, funnels, form analytics, and feedback campaigns.
  • Advantages: Comprehensive session replay, detailed heatmaps for all site interactions, and robust form analysis.
  • Disadvantages: Can be overwhelming for beginners due to the depth of data and features.
  • Cost: Free for a small amount of data; paid plans start at $24/month.

Lucky Orange is an all-encompassing suite of conversion optimization tools designed to provide a comprehensive understanding of user behavior through its robust set of features, including dynamic heatmaps, session recordings, and interactive surveys. In addition to these, it offers live chat capabilities, allowing for real-time interaction with site visitors. This integrated approach gives a detailed view of how users engage with a site, highlighting areas for improvement and opportunities to enhance the user experience. With its straightforward setup and user-friendly dashboard, Lucky Orange is a popular choice for businesses looking to increase conversions and drive website success.

Heatmap with Lucky Orange
Lucky Orange heatmaps
  • Features: Dynamic heatmaps, session recordings, conversion funnels, form analytics, live chat, and visitor polls.
  • Advantages: Real-time data, broad range of features beyond heatmaps, and interactive options like live chat to engage users.
  • Disadvantages: Can be data-heavy and slightly complex for smaller sites or beginners.
  • Cost: Plans start at $10/month with a 7-day free trial.

FullStory is a digital experience intelligence platform that excels in offering robust session replay and heatmap UX capabilities. It's designed to capture a comprehensive, data-driven picture of user interactions, providing insights into how users navigate and experience a website or application. FullStory's powerful analytics help identify patterns, pinpoint frustrations, and uncover opportunities to improve user experience. Its detailed session replays and intuitive heatmaps make it an essential tool for anyone looking to enhance website usability and conversion rates.

Heatmap with FullStory
Fullstory heatmaps
  • Features: Click and movement heatmaps, session replay, user segments, and frustration signals like rage clicks.
  • Advantages: Deep insights with high-quality replays, user segmentation, and advanced search functions to pinpoint issues.
  • Disadvantages: Pricing can be high for full-featured access and might be more than needed for smaller projects.
  • Cost: Custom pricing based on usage, with a free version offering limited sessions.

Clicktale (now part of Contentsquare)

Clicktale, now a part of Contentsquare, is renowned for its in-depth experience analytics capabilities, offering a comprehensive suite of tools including heatmaps, session replays, and conversion analytics. It excels in dissecting complex user interactions to provide a granular view of how users engage with every element of a website. By capturing a wide array of behavioral data, Clicktale helps businesses understand the 'why' behind user actions, enabling them to optimize their digital experiences effectively. This tool is particularly valuable for large-scale enterprises looking to deeply understand customer journeys and improve conversion rates.

Contentsquare heatmaps
Heatmaps with Contentsquare
  • Features: Heatmaps for mouse movement, clicks, and attention, session replays, link analytics, and form optimization.
  • Advantages: Advanced visual and behavioral analytics integrated with powerful segmentation and replay capabilities.
  • Disadvantages: As part of a larger suite, it can be quite complex and more expensive.
  • Cost: Custom pricing based on specific business needs and scale.

Each of these tools provides unique features and insights into user behavior, helping businesses optimize their websites and applications for better user experience and conversion rates. They vary in their complexity, range of features, and pricing, offering options for different types and sizes of businesses.

Conclusion

In conclusion, employing heat maps is a game-changer in the realm of UI/UX design, providing invaluable insights that drive informed decisions and significantly enhance user experience. Tools like Hotjar, Crazy Egg, and Clicktale, among others, offer diverse features that cater to various analytical needs, ensuring that every aspect of user interaction is understood and optimized. 

Gapsy Studio has a proven track record of leveraging these innovative tools to deliver optimized, user-centered designs that not only look stunning but also perform exceptionally. Whether you're looking to improve your website's usability, increase conversion rates, or simply provide a more engaging user experience, Gapsy Studio's expertise is your asset.

Don't let your website be left behind in the ever-evolving digital landscape. Reach out to Gapsy Studio today to explore how their UI/UX design services can transform your digital presence. Visit the contact page to start your journey towards a more insightful, user-focused design strategy!

Rate this article

20 ratings
Average: 4.9 out of 5

If you like what we write, we recommend subscribing to our mailing list to always be aware of new publications.

Do you have any questions? We tried to answer most of them!